Scatter
Lab setup
First, make sure you have completed the initial setup.
If you are part of a course
-
Open Terminal. Run the update command to make sure you have the latest code.
$ mwc update -
Move to this lab's directory.
$ cd ~/Desktop/making_with_code/mwc1/unit2/lab_scatter
If you are working on your own
-
Move to your MWC directory.
$ cd ~/Desktop/making_with_code -
Get a copy of this lab's materials.
git clone https://git.makingwithcode.org/mwc/lab_scatter.git
In this lab, we are going to write a function, scatterplot, which
takes a list of [x, y] lists, and which uses the turtle library
to draw a scatter plot like the one below. There are several goals:
- Become familiar with writing functions which transform inputs into outputs
- Use functions to break a complicated problem down into simpler problems.
- Practice writing a more complex program than we have tackled before.
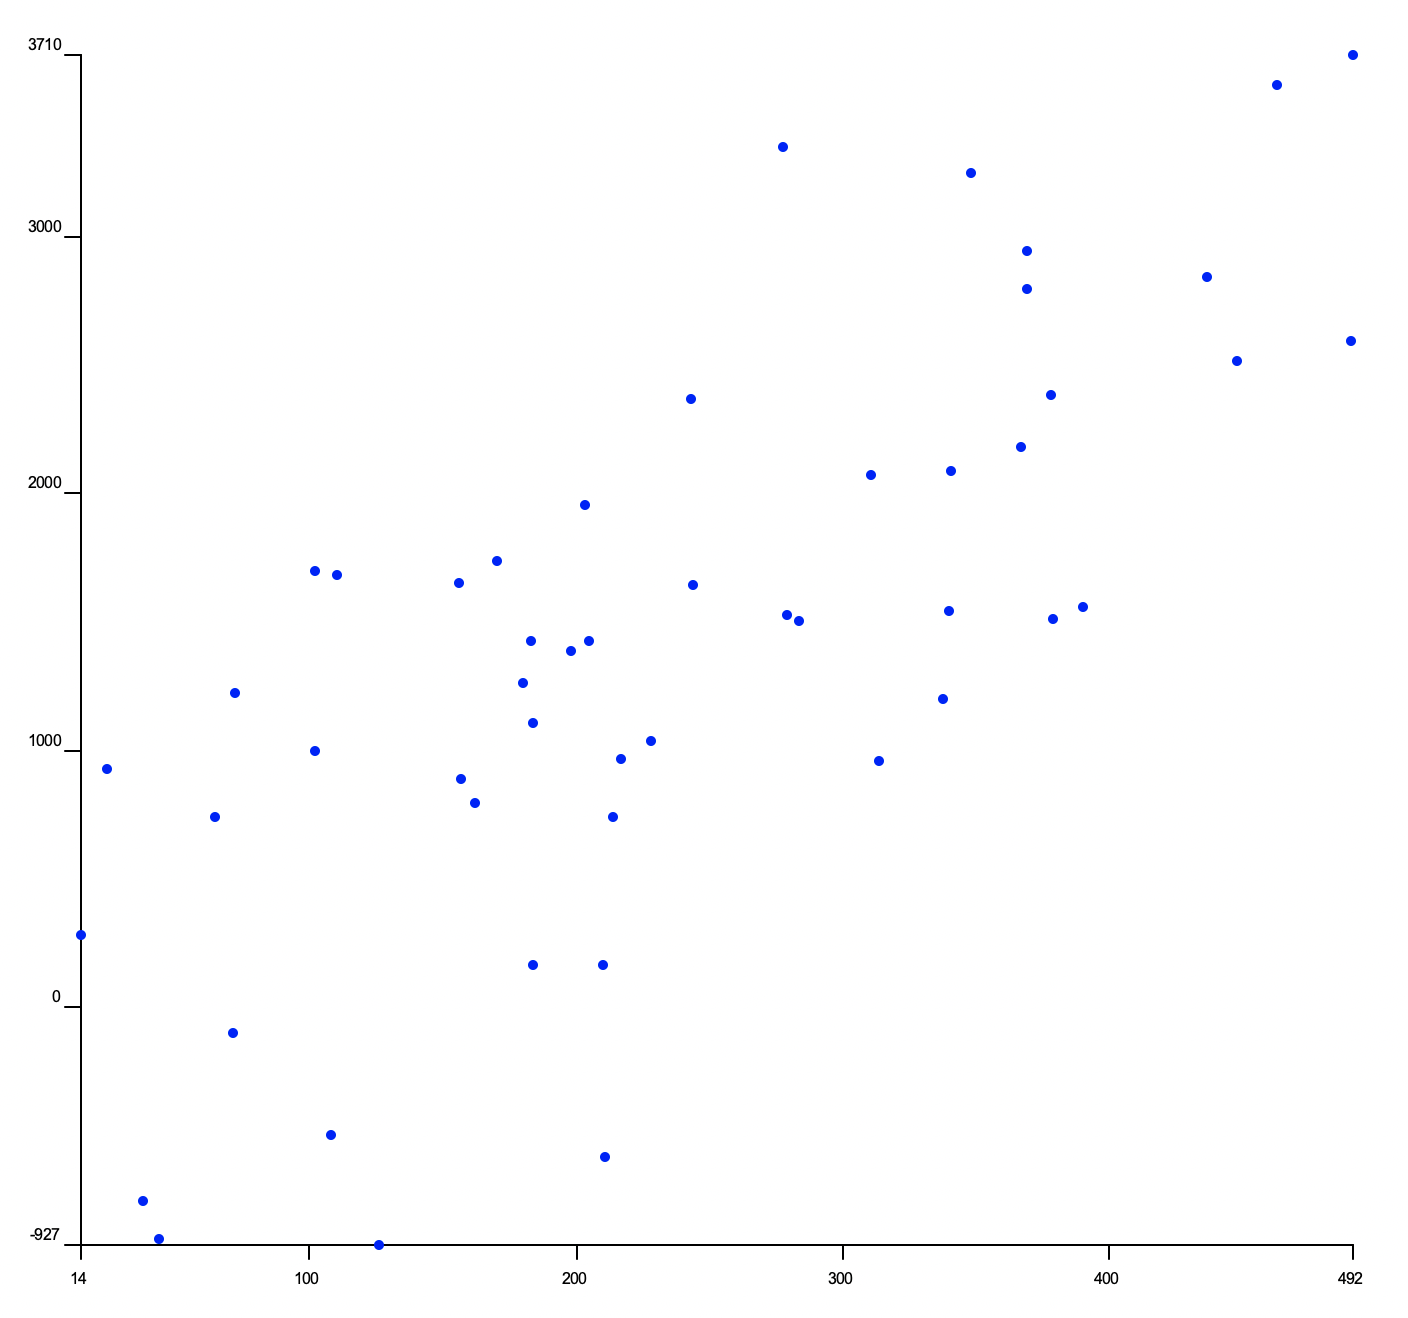
Note some of the features of this scatter plot:
- The plot is automatically scaled to the x- and y-bounds of the data. The x-axis ranges from 14 to 492, while The y-axis ranges from -927 to 3710.
- The x-axis and the y-axis are both labeled. Each axis has ticks at the minimum and maximum values, and evenly-spaced ticks in between, using a suitable scale. The y-axis has ticks at every 1000, while the x-axis has ticks at every 100. (If we just drew ticks at every 100 on the y-axis there would be far too many ticks.)
- Each
[x, y]data point is drawn on the scatter plot as a dot. The size and color of dots can be adjusted using optional arguments.
Top-down and bottom-up problem solving
Top-down problem solving (sometimes called decomposition) involves taking a hard problem (like drawing a scatter plot), and breaking it into smaller, more manageable, problems. Bottom-up problem solving goes the other direction: starting with small pieces you know how to do (like drawing a line for an axis on the plot), and using these to create more powerful tools you can use to solve bigger problems.
You probably already used these strategies in the drawing project, but it's a good time to mention them explicitly.
Transforming data with functions
Now that you have done some top-down thinking, we are going to work from the bottom-up, writing some simple functions which transform data in useful ways. First, we need a few new tools for writing functions.
💻
Open transform.py and skim the contents.
Each of these functions currently raises
an error which will intentionally crash your program with an error
message saying the function isn't finished. Delete these error messages, and
instead write the functions so that they return the correct values.
minimum(data)
- input:
datais a list like[3, 6, 7]. - output: the smallest number in the list.
Examples:
>>> minimum([1, 2, 3])
1
>>> minimum([-40, -60, -80])
-80
>>> minimum(range(1000))
0
The simplest strategy for finding the minimum value is to create a variable to store
the lowest number. Then iterate through data, checking to see whether each number is lower
than the previous lowest. If so, then it's the new lowest number:
def minimum(data):
lowest = None
for number in data:
if lowest is None:
lowest = number
if number < lowest:
lowest = number
return lowestA few points to note:
- On line 2, we need a value for
lowestbefore we start looking through the list.Nonewill do nicely--after all, it represents nothingness. - Then, on line 4, we check whether
lowest is None. This will only be true when we get to the very first number. We haven't seen any numbers yet, so this first number should be assigned as lowest (line 5). - Then, lines 6 and 7 check whether the number is lower than the lowest we've seen so far. If so, that number becomes lowest.
- Finally, on line 8, we return lowest. Line 8 is not part of the for-loop on lines 3-7; we don't want to return anything until we have already gone through the whole list.
maximum(data)
- input:
datais a list like[3, 6, 7]. - output: the largest number in the list.
Examples:
>>> maximum([1, 2, 3])
3
>>> maximum([-40, -60, -80])
-40
>>> maximum(range(1000))
999
This function is almost exactly the same as minimum, but instead of lowest,
you should keep track of the highest number in the list and return it at the end.
bounds(data)
- input:
datais a list like[3, 6, 7]. - output: a list containing the largest and smallest numbers in the list.
Examples:
>>> bounds([1, 2, 3])
[1, 3]
>>> bounds([-40, -60, -80])
[-80, -40]
>>> bounds(range(1000))
[0, 999]
Now that you have minimum and maximum, this function will be easy to write.
clamp(value, low, high)
- input:
value,low, andhighare numbers. - output: If
valueis betweenlowandhigh, then returnsvalue. Ifvalueis lower thanlow, returnslow. Ifvalueis higher thanhigh, returnshigh.
Examples:
>>> clamp(10, 0, 100)
10
>>> clamp(-10, 0, 100)
0
>>> clamp(104, 0, 100)
100
ratio(value, low, high)
- input:
value,start,end - output: A number between 0.0 and 1.0.
Examples:
>>> ratio(5, 0, 10)
0.5
>>> ratio(167, 100, 200)
0.67
>>> ratio(8, 10, 0)
0.2
>>> ratio(4, 10, 20)
0.0
The formula for ratio is simple. We divide the distance traveled (value - start)
by the total distance to be traveled (end - start). Don't forget to clamp
value, so that the return is always between 0.0 and 1.0.

scale(value, domain_min, domain_max, range_min, range_max)
- input:
value,domain_min,domain_max,range_min, andrange_maxare numbers. - output: A number. The equivalent of
valuescaled from domain to range.
Examples:
>>> scale(4, 0, 10, 0, 100)
40
>>> scale(160, 120, 240, 0, 100)
33.33
In the scatter plot, we will use scale to figure out where points should be drawn on
the screen, scaling the x- and y-values of data from their actual bounds to the
size of the plot on the screen.
To scale a value, find its ratio in the domain (using ratio) and then
find the equivalent value in the range. If r is the ratio, then the scaled value
will be:

get_x_values(points)
- input:
pointsis a list of 2-item lists representing x- and y-coordinates of points in a plane. - output: a list containing just the x-coordinates
Examples:
>>> get_x_values([[0, 5], [1, 5], [2, 5]])
[0, 1, 2]
This function is pretty straightforward--given a list of 2-item lists, returns a list of just the first item from each list. Here are a few useful tools for interacting with lists:
get_y_values(points)
- input:
pointsis a list of 2-item lists representing x- and y-coordinates of points in a plane. - output: a list containing just the y-coordinates
Examples:
>>> get_x_values([[0, 5], [1, 5], [2, 5]])
[5, 5, 5]Building the scatter plot
Now we will use these functions to create a scatter plot.
💻
Open scatterplot.py and skim the code. Also open
plotting.py and ticks.py, as you will need to use functions provided in these
modules. (They have already been imported into scatterplot.py for you.)
Then, using the plan below,
implement the scatterplot function and its sub-functions.
Drawing a scatterplot
This function is completed for you. All it does is call other functions:
- Prepare the screen (
prepare_screen()) - Draw the axes (
draw_axes(data)) - Draw the points (
draw_points(data))
Drawing the axes
draw_axes is responsible for drawing the scatter plot's axes. Here's the plan
for drawing the x-axis:
- Draw the axis line.
- Draw and label the ticks.
- Get the x-values from the data.
- Find the bounds of the x-values.
- Use the x-bounds to get the x tick values.
- For each tick value:
- Figure out its position on the screen by scaling its value to the plot width.
Here's what that plan looks like in code:
draw_x_axis()
x_values = get_x_values(data)
xmin, xmax = bounds(x_values)
ticks = get_tick_values(xmin, xmax)
for tick in ticks:
    screen_x_position = scale(tick, xmin, xmax, 0, constants.PLOT_WIDTH)
    draw_x_tick(screen_x_position, tick)
You'll need similar code for the y-axis.
Drawing the points
Drawing the points is a bit easier than drawing the axes. Here's the plan:
- Find the x-bounds and the y-bounds of the data. You'll need these for scaling.
- For each point in the data:
- Get the x and y value from the point.
- Find the scaled x-position for the point.
- Find the scaled y-position for the point.
- Use
draw_point(scaled_x, scaled_y, color, size)to draw the point.